Water Quality Table – UCMR5*
Detailed Accessible Table Description
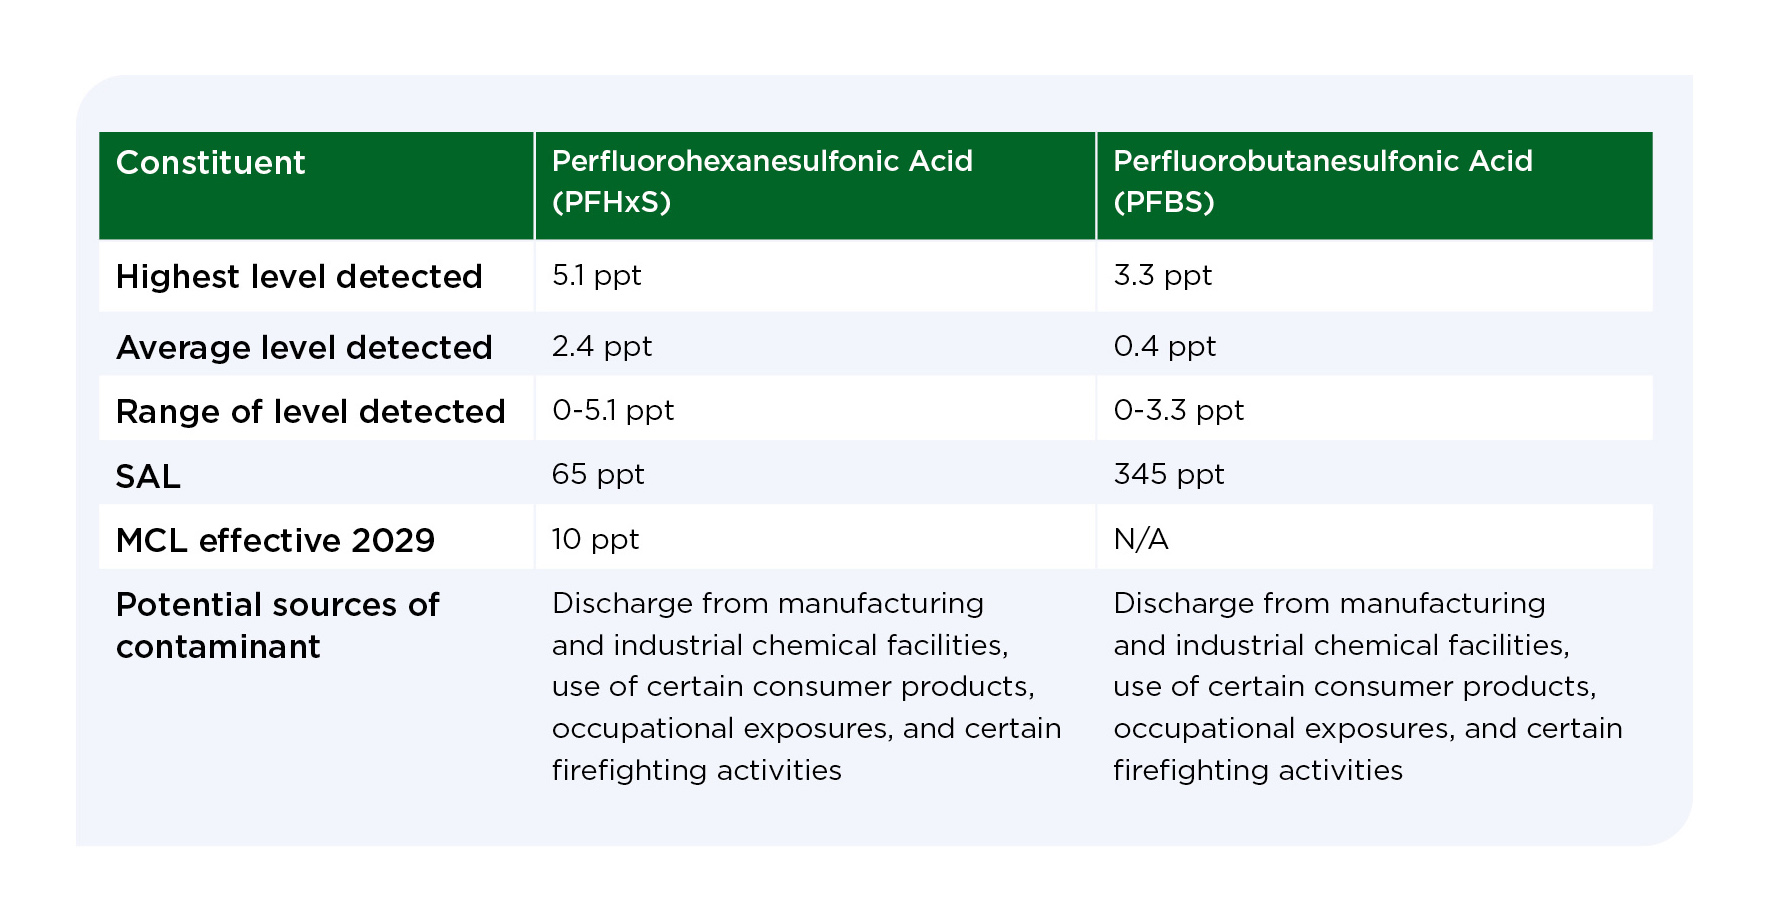
The table presents monitoring results for two constituents:
- Perfluorohexanesulfonic Acid (PFHxS)
- Perfluorobutanesulfonic Acid (PFBS)
The first column lists attribute categories. The second and third columns list the corresponding values for PFHxS and PFBS.
The table contains the following rows and values:
Highest level detected
- PFHxS: 5.1 ppt
- PFBS: 3.3 ppt
Average level detected
- PFHxS: 2.4 ppt
- PFBS: 0.4 ppt
Range of level detected
- PFHxS: 0 to 5.1 ppt
- PFBS: 0 to 3.3 ppt
SAL (State Action Level)
- PFHxS: 65 ppt
- PFBS: 345 ppt
MCL effective 2029
- PFHxS: 10 ppt
- PFBS: Not applicable (N/A)
Potential sources of contaminant
- PFHxS: Discharge from manufacturing and industrial chemical facilities, use of certain consumer products, occupational exposures, and certain firefighting activities.
- PFBS: Discharge from manufacturing and industrial chemical facilities, use of certain consumer products, occupational exposures, and certain firefighting activities.